Might things be easing up?

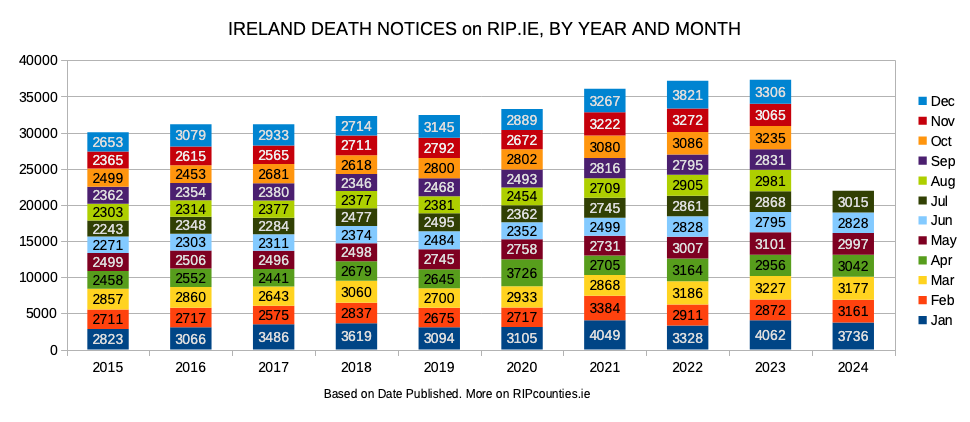
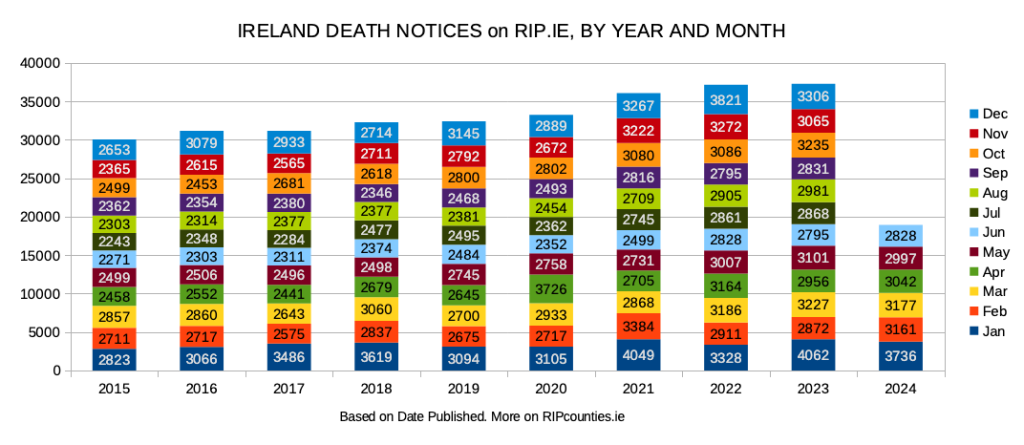
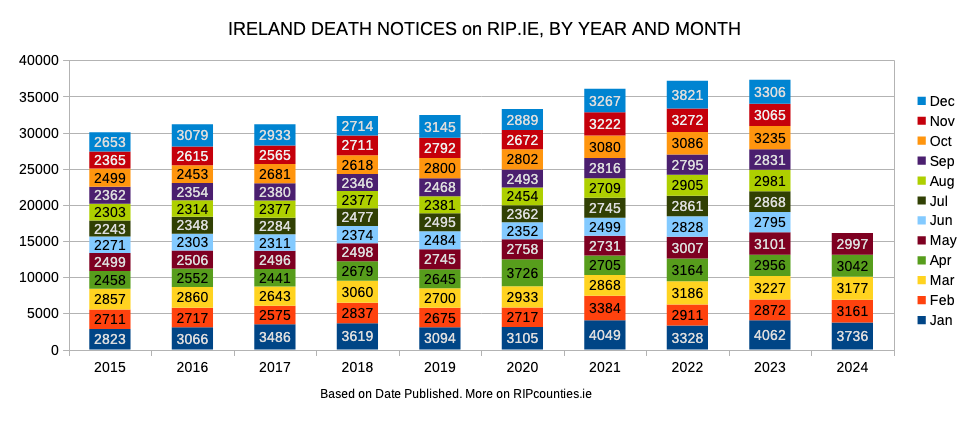
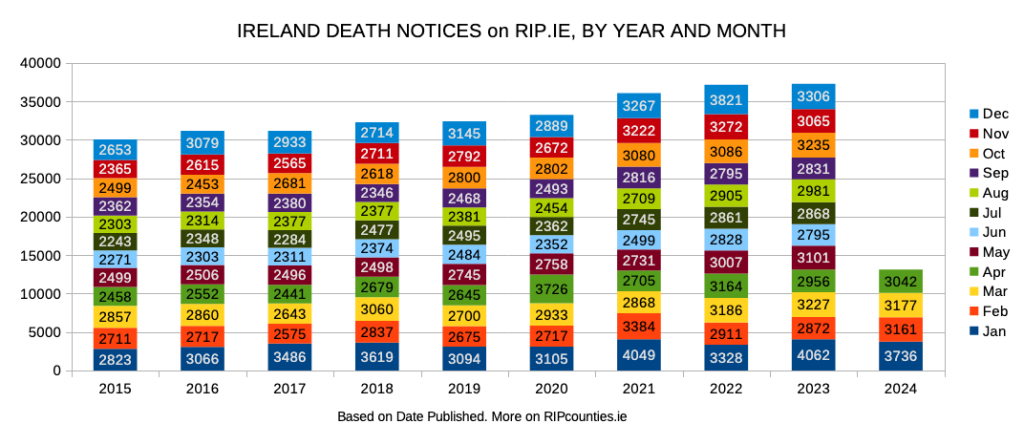
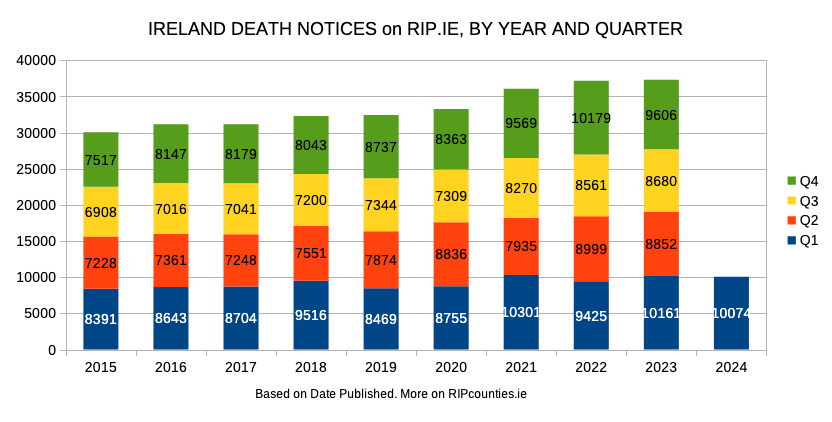
This November saw 2931 death notices for Ireland. That’s 9.7% more than November 2020 and brings this years running total to 33757 – which is 11% (3383) ahead of where we were by this point in 2020.
However this November:
- is down 4% (134) on November 2023, and
- is the first November since 2020 with fewer than 3000 deaths
December’s figures will indicate whether this drop in the numbers dying is a temporary change or indicates a new trend is emerging.