April 3rd, 2024: as described in this post, changes to how the RIP.ie site works invalidated the LibreOffice Calc method described below. So, we have archived this page. Thankfully, a more proficient spreadsheet user made contact and helped develop an Excel alternative. You can download a copy (with dummy data and embedded instructions) on the DIY page.
Main steps
1. Get the RIP.ie data
On the search form on RIP.ie choose a county (e.g. Mayo), a date range (e.g. 1/1/2020 to 31/12/2020) and click ‘Search’.
When the results appear, click the heading “Published’ in the right-hand column until the records are sorted beginning from 1st January.
Select the content (Name, Address, County, Date) on Page 1.
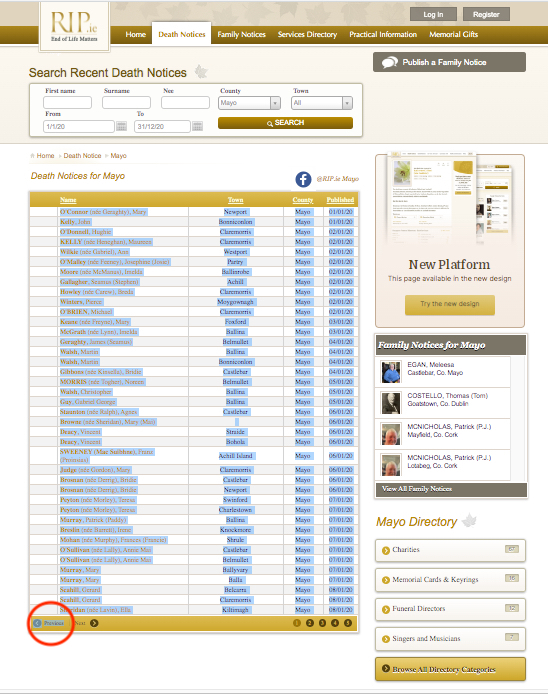
Copy and paste into a spreadsheet.
Return to RIP.ie and repeat for Pages 2, 3. 4 etc of your search results.
2. Clean up the data
[These instructions are for LibreOffice Calc. You will need to adapt for Excel or other.]
When all results are pasted into your spreadsheet, tidy up the alignment of columns / cells in your sheet.
Next, remove the duplicates. Select the column of names. Apply Format > Conditional > Condition… Cell Value > is duplicate > Apply Style: Bad (or the style you prefer). Scroll down and scan the name column for the highlighted cells (usually next to each other). Our contributors generally deleted the second of a repeated entry.
– Note 1: the software will flag all duplicates. So if a name appearing in January matches one in October, both will be flagged. But clearly they are not referring to the same individual so both entries should be retained.
– Note 2: if someone died abroad there may be a delay in their remains (or ashes) being brought home. Or they may be buried abroad a few weeks after their death is noted.1Some countries take longer to bury the deceased than we do in Ireland. So there may be two entries – one on (or near) the day of their death; the other some weeks later regarding their ceremony. Our contributors generally deleted the second entry.
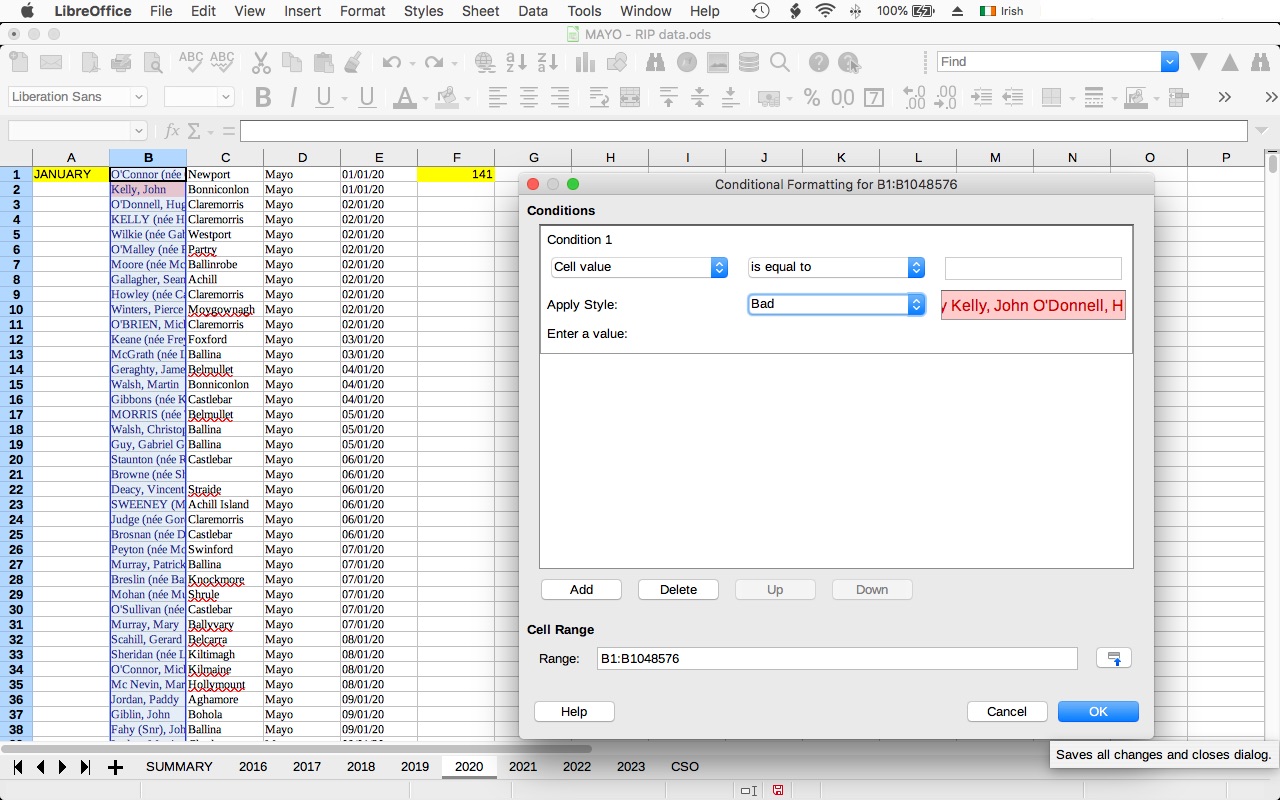
Next, highlight the beginning or end of each month as desired. (We used cells in Column A to mark the start of each month. See image above).
Then, in an appropriate empty cell (we used Column F – see image above), enter the COUNTIF formula to count the number of entries for each of the twelve months. For example, if the Names are in Column B:
=COUNTIF(B1:B141,"*")
=COUNTIF(B142:B246,"*")
=COUNTIF(B247:B370,"*")
... etc.,
In the same Calc / Excel document, create a new sheet and repeat the process for each year you intend studying.
3. Get your county population figures
You can find them on the ‘CSO’ sheet of our sample Calc document.
Or, go to CSO and search for form FP002 (“Preliminary Actual and Percentage Change in Population from 1926 to 2022”). When it appears, select your desired year(s) and county (or counties).
Click to “View” the results on the website, or “Download” the XLSX file (our preference).
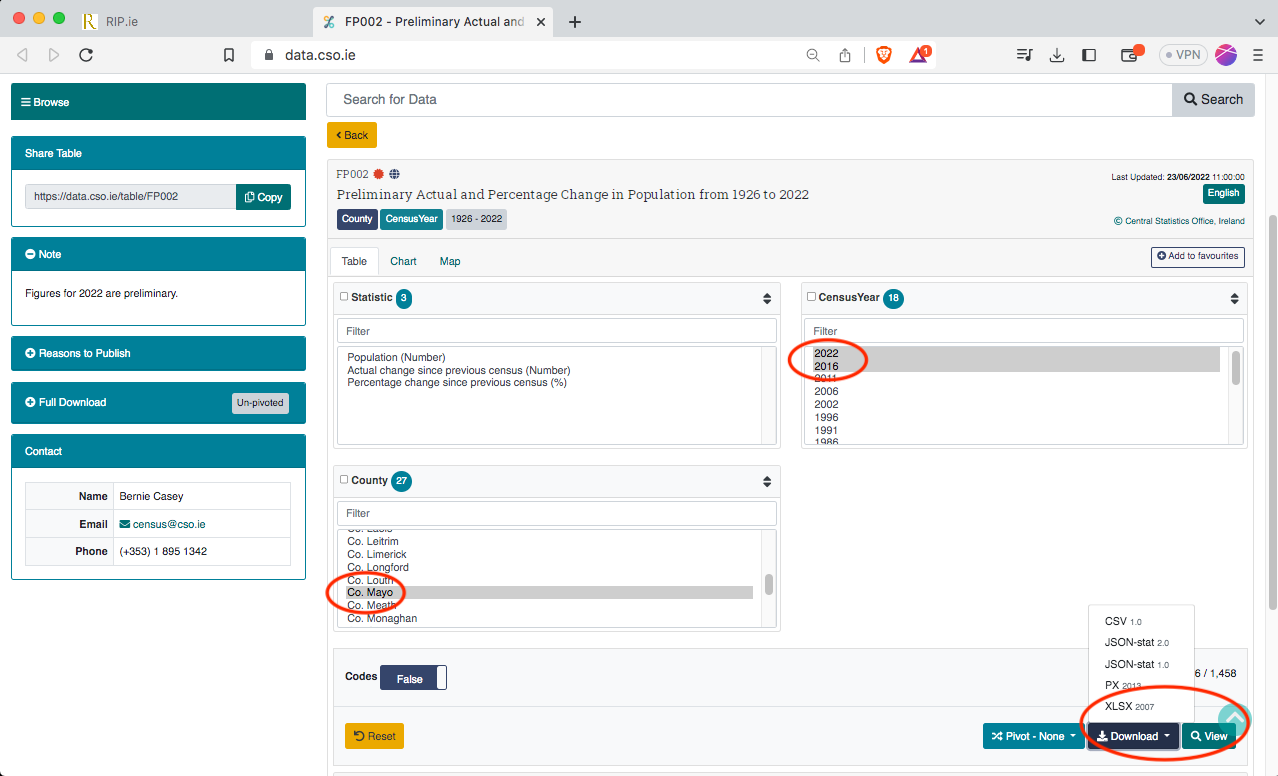
Copy and paste the CSO figures into a new sheet in your Calc/Excel document. [See important note below about how we used population data.]
4. Compile into a summary sheet
Create a new sheet and use your CSO and year sheet(s) to create a table to suit your analysis and graph plans.
Or copy the summary sheet from our sample Calc document? As that copy will also contain our graph formulae, once you update the summary table with your own county’s figures, the graph(s) should update automatically.
The formulae to use in the summary table cells (where ‘2020’ refers to the sheet we made for our 2020 data and B1, B102 etc are the cells in our 2020 sheet containing a given month’s death figures) will be similar to this :
=$'2020'.B1
=$'2020'.B102
=$'2020'.B186
... etc.,
About our population figures
The CSO produces population figures based on Census surveys. This means we cannot be sure of population size between Census years. To compensate we:
- calculated the difference between adjacent Census years e.g. population 2022 minus population 2016
- divided that difference by the number of separating years (in this case 6)
- increased / decreased each year’s population by that figure (rounding up/down as appropriate).
Those sums can be done manually. Or, assuming your 2016 population figure is in cell U2 and that of 2022 is in cell U8, use the following formulae in cells U3 to U7:
=(U2+(($U$8-$U$2)/6))
=(U3+(($U$8-$U$2)/6))
=(U4+(($U$8-$U$2)/6))
=(U5+(($U$8-$U$2)/6))
=(U6+(($U$8-$U$2)/6))
We then assumed the same trend of population growth for 20232Clearly this will not be the case given Ireland’s recent approach to immigration. But in the absence of firm figures this is the best suggestion we’ve come up with. so cell U9 contains the formula:
=(U8+(($U$8-$U$2)/6))Good luck!
- 1Some countries take longer to bury the deceased than we do in Ireland.
- 2Clearly this will not be the case given Ireland’s recent approach to immigration. But in the absence of firm figures this is the best suggestion we’ve come up with.